Essay
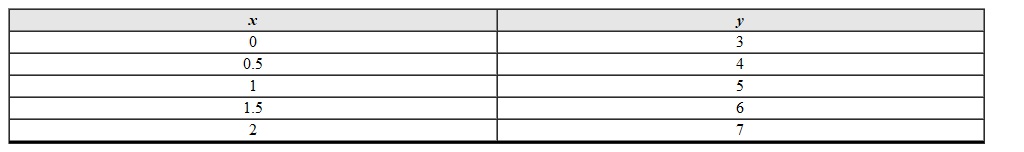
Use the data given to create a scatterplot. Clearly label and scale the axes.
Correct Answer:

Verified
Correct Answer:
Verified
Related Questions
Q203: Find the value of <img src="https://d2lvgg3v3hfg70.cloudfront.net/TBX8673/.jpg" alt="Find
Q204: Given the data below how can you
Q205: The amount of an investment A after
Q206: The value V of a historic vehicle
Q207: Use the bar chart to answer the
Q209: State the scale on both the x-
Q210: Use the table to make a bar
Q211: Using the table below determine the value
Q212: <img src="https://d2lvgg3v3hfg70.cloudfront.net/TBX8673/.jpg" alt=" and 2x are
Q213: The table below illustrates a set of