Multiple Choice
The graph below shows distance as a function of time (measured in seconds) for an Olympic swimmer racing in the 100-meter butterfly. Determine the best answer for the average speed of the swimmer for the 100-meter butterfly. (Rounded to the nearest hundredth) 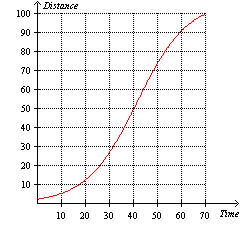
A) 1.39 meters/sec
B) 70 meters/sec
C) 1 meters/sec
D) 0.72 meters/sec
E) 100 meters/sec
Correct Answer:

Verified
Correct Answer:
Verified
Q147: At your job you earn $9.50 per
Q148: The solution to the equation <img src="https://d2lvgg3v3hfg70.cloudfront.net/TBX8673/.jpg"
Q149: Given the solution set drawn on the
Q150: The slope of the function <img src="https://d2lvgg3v3hfg70.cloudfront.net/TBX8673/.jpg"
Q151: Translate the sentence into an equation. <br>
Q153: For the linear equation <img src="https://d2lvgg3v3hfg70.cloudfront.net/TBX8673/.jpg" alt="For
Q154: You are driving on a long highway
Q155: An economist models the market for rice
Q156: Translate the sentence into an equation. <br>
Q157: Given the solution set drawn on the