Multiple Choice
The graph of a function that models exponential growth is shown. What is the initial population? 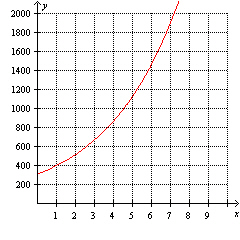
A) 0
B) 300
C) Not enough information
D) 390
E) 1.3
Correct Answer:

Verified
Correct Answer:
Verified
Related Questions
Q288: Use the graph to find the x-
Q289: In the first year of her life
Q290: The point where the curve touches the
Q291: Find the slope of the line that
Q292: Which one of the following functions describes
Q294: The data table represents hours you work
Q295: In 1990 a town's population was 21435.
Q296: Is the graph of the equation <img
Q297: Determine whether the following relation is a
Q298: The half-life of Iodine-135 is 8 days.