Multiple Choice
The population of Arizona was 5.1 million in 2000 and 7.7 million in 2008. If the population grew linearly which one of the following models the population as a function of time (in years since 2000) ?
A) 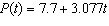
B) 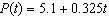
C) 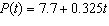
D) 
E) 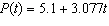
Correct Answer:

Verified
Correct Answer:
Verified
Q270: Find the y- intercept of the equation
Q271: The function <img src="https://d2lvgg3v3hfg70.cloudfront.net/TBX8673/.jpg" alt="The function
Q272: Find the slope of the line that
Q273: Using the following table of a function
Q274: For <img src="https://d2lvgg3v3hfg70.cloudfront.net/TBX8673/.jpg" alt="For find
Q276: Using the following table of a function
Q277: Use the graph to find the x-
Q278: Use the equation to create a table
Q279: Using the following table of a function
Q280: Which one of the following scenarios does