Essay
A lake is initially stocked with 500 turtles and the turtle population is sampled at 8-week intervals to estimate the population size. The table illustrates the data gathered from the sampling.
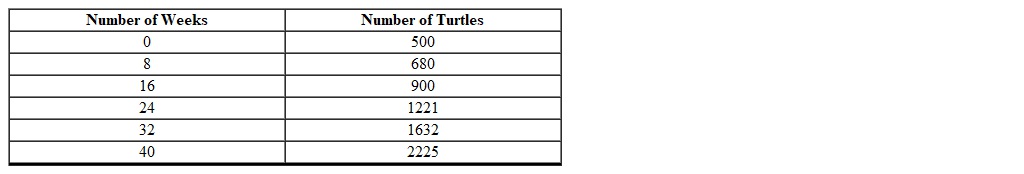 Using a graphing calculator find an appropriate curve that models the turtle population as a function of the number of weeks (round to the nearest thousandth).
Correct Answer:

Verified
Correct Answer:
Verified
Q251: Using the following table of a function
Q252: Determine the equation of the line that
Q253: The graph displays the number of tickets
Q254: The revenue (in millions) of a struggling
Q255: The amount of credit card debt that
Q257: Graph the equation <img src="https://d2lvgg3v3hfg70.cloudfront.net/TBX8673/.jpg" alt="Graph the
Q258: Use the graph to find the equation
Q259: Find the x- intercept of the equation
Q260: The slope of a horizontal line is
Q261: Is the graph of the equation linear