Essay
The revenue of a company is being monitored each month. The initial revenue is $1.3 million. The table illustrates the data gathered over a 6-month time period.
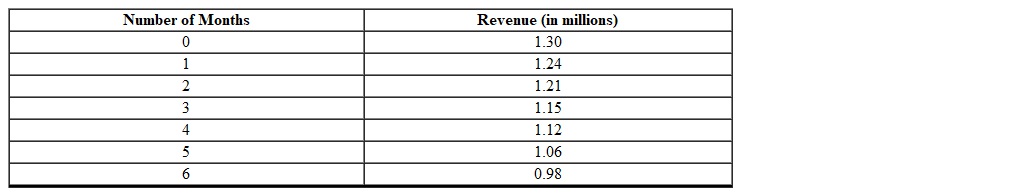 Using a graphing calculator find an appropriate curve that models the revenue as a function of the number of months (round to the nearest thousandth).
Correct Answer:

Verified
Correct Answer:
Verified
Q81: Determine the equation of the line that
Q82: Decide whether you would graph the equation
Q83: Atmospheric pressure (measured in atm) decreases by
Q84: What type of function does the data
Q85: Sally wishes to invest $4500 in a
Q87: Using the following table of a function
Q88: Graph the equation <img src="https://d2lvgg3v3hfg70.cloudfront.net/TBX8673/.jpg" alt="Graph the
Q89: The number of ants in a colony
Q90: Graph the equation <img src="https://d2lvgg3v3hfg70.cloudfront.net/TBX8673/.jpg" alt="Graph the
Q91: For the function <img src="https://d2lvgg3v3hfg70.cloudfront.net/TBX8673/.jpg" alt="For the