Multiple Choice
To graph the given set of points in the input-output table a reasonable choice for the y scale is what value? 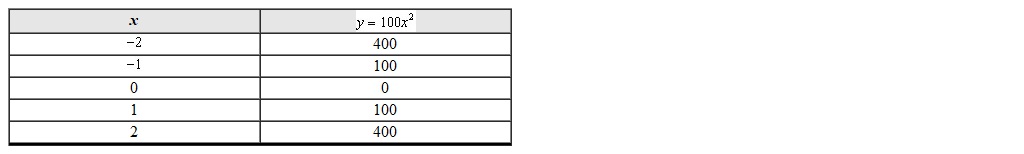
A) 1
B) 10
C) 100
D) 1000
Correct Answer:

Verified
Correct Answer:
Verified
Q178: The table represents data for an exponential
Q179: Find the slope of the line that
Q180: Graph the equation <img src="https://d2lvgg3v3hfg70.cloudfront.net/TBX8673/.jpg" alt="Graph the
Q181: For <img src="https://d2lvgg3v3hfg70.cloudfront.net/TBX8673/.jpg" alt="For find
Q182: Determine whether the graph represents a function.
Q184: The graph of the equation <img src="https://d2lvgg3v3hfg70.cloudfront.net/TBX8673/.jpg"
Q185: After college graduation Sheena was offered two
Q186: Determine the equation of the line that
Q187: Use the graph to find the x-
Q188: The function <img src="https://d2lvgg3v3hfg70.cloudfront.net/TBX8673/.jpg" alt="The function