Multiple Choice
The graph of the equation  is which of the following?
A) 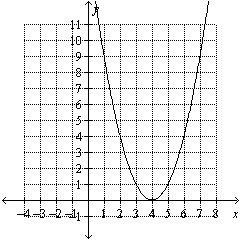
B) 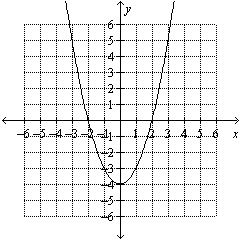
C) 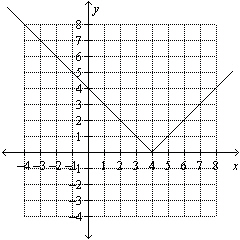
Correct Answer:

Verified
Correct Answer:
Verified
Related Questions
Q59: In 1990 a town's population was 21354.
Q60: Evaluate the function. <img src="https://d2lvgg3v3hfg70.cloudfront.net/TBX8673/.jpg" alt="Evaluate the
Q61: For the given input-output table complete the
Q62: Find the slope of the line given
Q63: Find the slope of the line given
Q65: Find the slope of the line that
Q66: Determine the equation of the line that
Q67: Find the x -intercept and the y-
Q68: Find the slope of the line that
Q69: In 1990 a town's population was 24382.