Essay
The graph displays the number of students enrolled in mathematics class for the number of days since registration opened. Calculate the slope for the line and interpret its meaning. 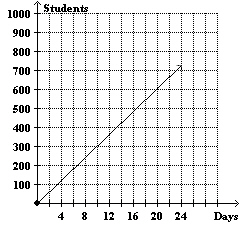
Correct Answer:

Verified
30
The r...View Answer
Unlock this answer now
Get Access to more Verified Answers free of charge
Correct Answer:
Verified
The r...
View Answer
Unlock this answer now
Get Access to more Verified Answers free of charge
Q4: Use the graph to find the equation
Q5: A graph of the equation <img src="https://d2lvgg3v3hfg70.cloudfront.net/TBX8673/.jpg"
Q6: Using the following table of a function
Q7: State whether the line graphed is increasing
Q8: State whether the line graphed is increasing
Q10: Two lines are perpendicular if the two
Q11: Find the slope of the line that
Q12: Graph the equation <img src="https://d2lvgg3v3hfg70.cloudfront.net/TBX8673/.jpg" alt="Graph the
Q13: State whether the line graphed is increasing
Q14: The model <img src="https://d2lvgg3v3hfg70.cloudfront.net/TBX8673/.jpg" alt="The model