Multiple Choice
Which one of the following graphs represents the function  ?
?
A) 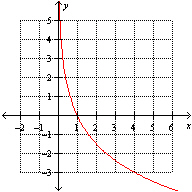
B) 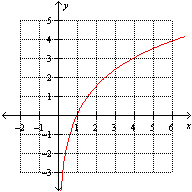
C) 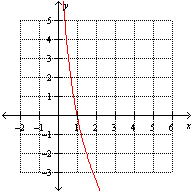
D) None of these options
E) 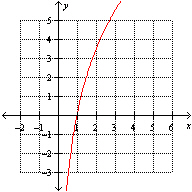
Correct Answer:

Verified
Correct Answer:
Verified
Related Questions
Q92: You bought snacks on two different days.
Q93: You need to work two part-time jobs.
Q94: Two angles are complementary. One angle has
Q95: Two functions and are given by the
Q96: If $49000 is invested at an interest
Q98: Use the Change of Base Formula to
Q99: The college Jazz Band is performing and
Q100: A linear inequality has infinitely many points
Q101: Use the table of values to solve
Q102: On August 18 2009 a 6.3 magnitude