Multiple Choice
During the years 1994 to 2007 seat belt use among front seat passengers ages 16 to 24 has increased. A linear model for the percentage of these passengers who use a seat belt is 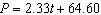 where P is percentage with a seat belt and t is years since 2000. The years before 2000 have a negative value for t. Use the model to predict the percentage of these passengers who used a seat belt in 2005.
A) 75%
B) 76.3%
C) 47.4%
Correct Answer:

Verified
Correct Answer:
Verified
Q44: If a quadratic model <img src="https://d2lvgg3v3hfg70.cloudfront.net/TBX8673/.jpg" alt="If
Q45: The percentage P of 6 to 11
Q46: The graph shows the average monthly high
Q47: The population of the District of Columbia
Q48: A _ model fits data points that
Q50: During the years 2002 to 2008 smoking
Q51: The Supplemental Nutrition Assistance Program (SNAP) to
Q52: A quadratic model for the median home
Q53: A quadratic model for the median price
Q54: Given a quadratic model <img src="https://d2lvgg3v3hfg70.cloudfront.net/TBX8673/.jpg" alt="Given