Essay
You have moved to Chicago in the fall. The graph shows the average monthly high temperature for months since you moved to Chicago. If a quadratic model  is fit to the graphed data set estimate the coordinates of the vertex.
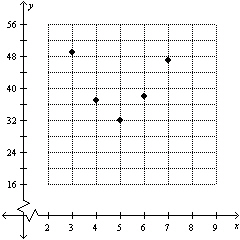
Correct Answer:

Verified
Correct Answer:
Verified
Related Questions
Q15: The Supplemental Nutrition Assistance Program (SNAP) to
Q16: The Supplemental Nutrition Assistance Program (SNAP) to
Q17: Given the data set choose its scatterplot.
Q18: The percentage P of 6 to 11
Q19: The average profit in dollars A that
Q21: During the years 1994 to 2007 seat
Q22: The _ for a linear data set
Q23: During the years 2002 to 2008 smoking
Q24: Does the data graphed follow a linear
Q25: Decide which line fits the data best.<br>A)