Short Answer
You have moved to Chicago in the fall. The graph shows the average monthly high temperature for months since you moved to Chicago. A quadratic model for this data is 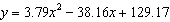 where y is the average monthly high temperature and x is months after you moved to Chicago. Use the model to predict the lowest average monthly high temperature. Round to the nearest month to make this estimate. Round to one decimal place.
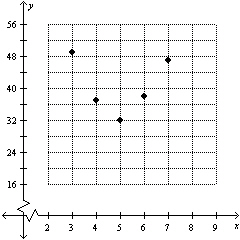
Correct Answer:

Verified
Correct Answer:
Verified
Q2: Given the data set draw a scatterplot.
Q3: When you estimate an output value for
Q4: The profit in dollars A that your
Q5: The percentage of eighth grade students P
Q6: The average profit in dollars A that
Q8: The average profit in dollars A that
Q9: Given the data set draw a scatterplot.
Q10: The percentage of eighth grade students P
Q11: Given the data set draw a scatterplot.
Q12: During the years 2002 to 2008 smoking