Multiple Choice
Which one of the following graphs represent the function: 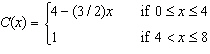
A) 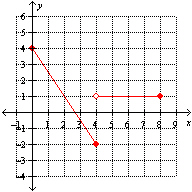
B) 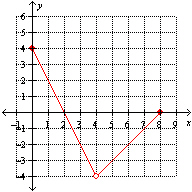
C) None of these options.
D) 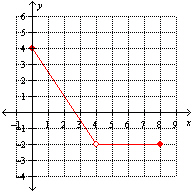
E) 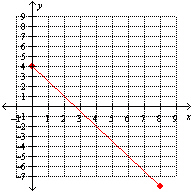
Correct Answer:

Verified
Correct Answer:
Verified
Related Questions
Q36: Which of the following formulas express the
Q37: The table below illustrates a set of
Q38: The distance d (in miles) that a
Q39: For the function <img src="https://d2lvgg3v3hfg70.cloudfront.net/TBX8728/.jpg" alt="For the
Q40: The following table shows the values of
Q42: Which one of the following represents the
Q43: A ball is thrown straight upward from
Q45: The price per gallon of gas at
Q73: If your quiz scores for MAT 101
Q361: If the temperatures over a 12-hour period