Multiple Choice
A population of rabbits was tracked over a 55-day period. The data is shown in the following graph. How did the population of rabbits change between day 3 and day 20? 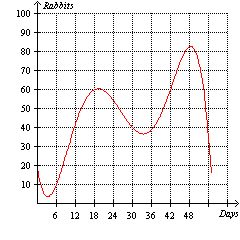
A) The population of rabbits increased from approximately 5 rabbits to 83 rabbits.
B) The population of rabbits decreased from approximately 83 rabbits to 5 rabbits.
C) The population of rabbits increased from approximately 5 rabbits to 61 rabbits.
D) The population of rabbits was constant during this time period.
E) The population of rabbits decreased from approximately 61 rabbits to 5 rabbits.
Correct Answer:

Verified
Correct Answer:
Verified
Q45: The price per gallon of gas at
Q47: Given the table below, find the net
Q48: Find a formula that models the speed
Q49: For the scatter plot below, which statement
Q51: Determine the domain and range of the
Q54: The resistance R of a wire (in
Q73: If your quiz scores for MAT 101
Q128: Find a function that models the area
Q206: The value V of a historic vehicle
Q343: A variable y is a function of