Multiple Choice
A population of rabbits was tracked over a 55-day period. The data is shown in the following graph. What was the maximum number of rabbits during this time period? 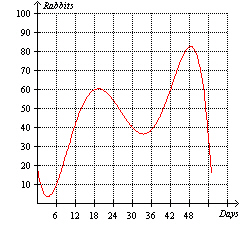
A) 61
B) 49
C) 38
D) 15
E) 83
Correct Answer:

Verified
Correct Answer:
Verified
Q12: If the temperatures over a 12-hour period
Q71: Given the data below, how can you
Q72: The number of gallons of water remaining
Q73: Find the domain of <img src="https://d2lvgg3v3hfg70.cloudfront.net/TBX8728/.jpg" alt="Find
Q75: For the function <img src="https://d2lvgg3v3hfg70.cloudfront.net/TBX8728/.jpg" alt="For the
Q76: The table below illustrates a set of
Q79: Does the equation y = -3 x
Q80: A ball is thrown straight upward from
Q81: The table below describes the average temperatures
Q271: The verbal description below can be represented