Multiple Choice
Which one of the following graphs illustrates the equation  ?
?
A) 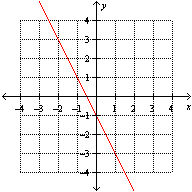
B) 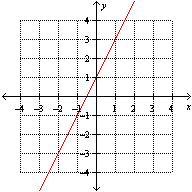
C) 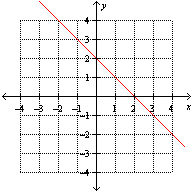
D) None of these options
E) 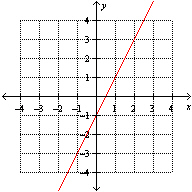
Correct Answer:

Verified
Correct Answer:
Verified
Related Questions
Q42: If the price of gas is $2.35
Q57: Find the equation of the line for
Q58: Using the graph below, determine the point
Q59: Find the slope and y -intercept for
Q60: Using the function <img src="https://d2lvgg3v3hfg70.cloudfront.net/TBX8728/.jpg" alt="Using the
Q64: Casey and Mark are running a race
Q65: Find the value of x that satisfies
Q66: The owner of a gas station records
Q67: The y -intercept of the function <img
Q172: If the gym charges $75 per month