Multiple Choice
A beanstalk grows at a constant rate. The beanstalk s height (inches) as a function of time (days) is modeled by  . Which of the following graphs illustrate the function h ?
A) 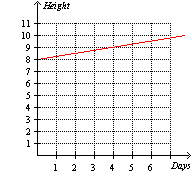
B) 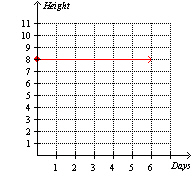
C) 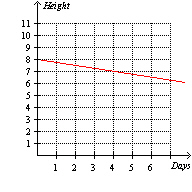
D) 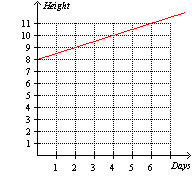
E) None of these options
Correct Answer:

Verified
Correct Answer:
Verified
Q15: An economist models the market for rice
Q16: The graph below shows distance as a
Q17: A quantity Q is related to quantity
Q18: If the slope of a line is
Q19: Find an equation for the line that
Q21: For the linear equation <img src="https://d2lvgg3v3hfg70.cloudfront.net/TBX8728/.jpg" alt="For
Q22: A swimming pool is being filled with
Q23: Which one of the following graphs illustrates
Q24: Which one of the following is the
Q25: For the linear equation <img src="https://d2lvgg3v3hfg70.cloudfront.net/TBX8728/.jpg" alt="For