Multiple Choice
The following table shows the swim times s for a certain swimmer for the 400-meter freestyle swims during the years 2001 to 2007. Let represent the year 2001.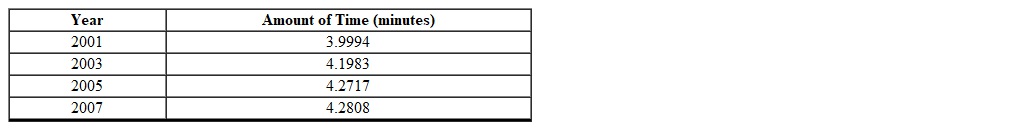
Which one of the following equations is the line of best fit for the data provided? (Rounded to the nearest ten-thousandths)
A) 
B) 
C) 
D) 
E) 
Correct Answer:

Verified
Correct Answer:
Verified
Q3: Judy is making fruit punch by mixing
Q21: For the linear equation <img src="https://d2lvgg3v3hfg70.cloudfront.net/TBX8728/.jpg" alt="For
Q22: A swimming pool is being filled with
Q23: Which one of the following graphs illustrates
Q24: Which one of the following is the
Q25: For the linear equation <img src="https://d2lvgg3v3hfg70.cloudfront.net/TBX8728/.jpg" alt="For
Q27: If <img src="https://d2lvgg3v3hfg70.cloudfront.net/TBX8728/.jpg" alt="If and
Q28: After taking a bath you begin to
Q29: For the linear equation <img src="https://d2lvgg3v3hfg70.cloudfront.net/TBX8728/.jpg" alt="For
Q30: A ball is thrown straight upward from