Multiple Choice
The graph of a function that models exponential growth is shown. What is the initial population? 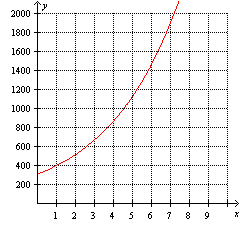
A) 0
B) 300
C) Not enough information
D) 390
E) 1.3
Correct Answer:

Verified
Correct Answer:
Verified
Q21: A region in the Arizona desert has
Q69: The average rate of change for the
Q70: Using the following table of a function
Q71: Using the following table of a function
Q72: The function <img src="https://d2lvgg3v3hfg70.cloudfront.net/TBX8728/.jpg" alt="The function
Q75: A town starts with 200 people and
Q76: The function <img src="https://d2lvgg3v3hfg70.cloudfront.net/TBX8728/.jpg" alt="The function
Q77: The amount of caffeine (in milligrams) left
Q78: The model <img src="https://d2lvgg3v3hfg70.cloudfront.net/TBX8728/.jpg" alt="The model
Q79: What is the average rate of change