Multiple Choice
Using the graph below, find the percentage rate of change from  to
to  .
. 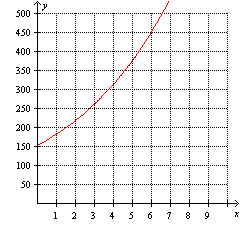
A) 4,026.0%
B) 51.8%
C) 311.0%
D) 150.0%
E) 107.4%
Correct Answer:

Verified
Correct Answer:
Verified
Related Questions
Q28: Using the following table of a function
Q29: A lake is initially stocked with 500
Q30: Which one of the following functions is
Q31: The population of Arizona was 5.1 million
Q32: The table represents data for an exponential
Q34: What is the percentage rate of change
Q35: Using the following table of a function
Q36: The function <img src="https://d2lvgg3v3hfg70.cloudfront.net/TBX8728/.jpg" alt="The function
Q37: The population of Smallville at time t
Q38: The amount of caffeine (in milligrams) left