Essay
The revenue of a company is being monitored each month. The initial revenue is $1.3 million. The table illustrates the data gathered over a 6-month time period.
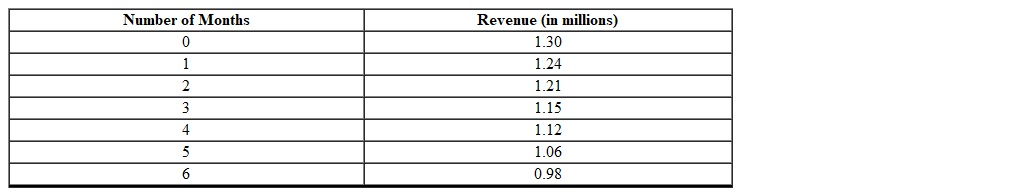
Using a graphing calculator, find an appropriate curve that models the revenue as a function of the number of months (round to the nearest thousandth).
Correct Answer:

Verified
Correct Answer:
Verified
Q61: The model <img src="https://d2lvgg3v3hfg70.cloudfront.net/TBX8728/.jpg" alt="The model
Q62: Which one of the following functions is
Q64: The model <img src="https://d2lvgg3v3hfg70.cloudfront.net/TBX8728/.jpg" alt="The model
Q65: Using the graph below, find the average
Q67: The percent rate of change for the
Q69: The average rate of change for the
Q70: Using the following table of a function
Q71: Using the following table of a function
Q134: Which one of the following scenarios does
Q315: The value of an investment doubles every