Essay
A patient was administered Iodine-123 before a thyroid imaging scan. The table illustrates the data gathered over a 12-hour time period.
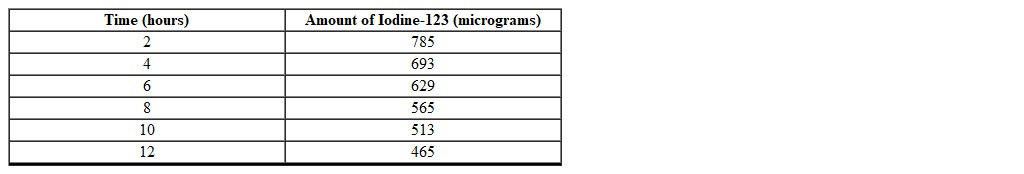
Using a graphing calculator, find an appropriate curve that models the amount of Iodine-123 (in micrograms) as a function of the time (in hours) (round to the nearest thousandth).
Correct Answer:

Verified
Correct Answer:
Verified
Q41: Which one of the following functions describes
Q42: Using the following table, find the average
Q44: The number of people infected with the
Q45: The amount of caffeine (in milligrams) left
Q47: The number of ants in a colony
Q48: The graph of a function that models
Q49: Morphine is administered to a patient intravenously
Q50: The number of people infected with the
Q51: The amount of caffeine (in milligrams) left
Q215: After college graduation Sheena was offered two