Multiple Choice
A diver jumps off the springboard and dives into a pool. The following table shows the distance of the diver from the surface of the water as a function of the time (in seconds) it takes for the diver to enter the water of the pool. 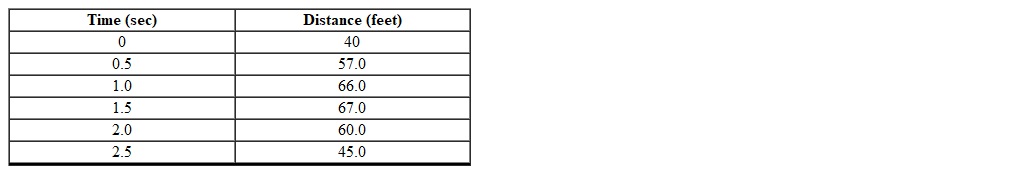 Which one of the following is an appropriate scatterplot for this data?
A) 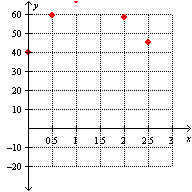
B) 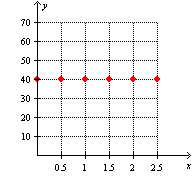
C) 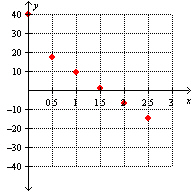
D) 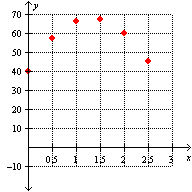
E) None of these options
Correct Answer:

Verified
Correct Answer:
Verified
Q63: Which one of the following functions describes
Q64: Sam has 600 ft of fencing to
Q65: Solve the equation <img src="https://d2lvgg3v3hfg70.cloudfront.net/TBX8728/.jpg" alt="Solve the
Q66: Using the graph below, find the x
Q67: A ball is thrown straight upward from
Q68: Using the data provided, create a quadratic
Q69: In a suspension bridge, the shape of
Q70: Find the minimum value and the corresponding
Q72: Which one of the following graphs illustrate
Q73: A ball is thrown straight upward from