Multiple Choice
The bar graph below shows the regions in which all the passenger cars were produced during a recent year. What percent of the passenger cars were produced in Latin America? Round your answer to the nearest percent. 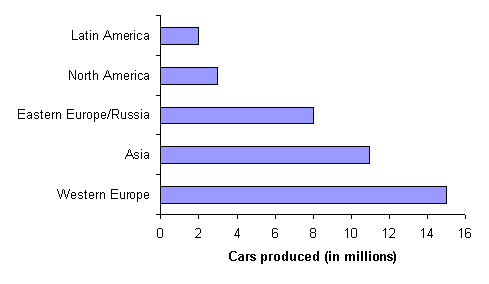
A) 21 %
B) 28 %
C) 38 %
D) 5 %
E) 8 %
Correct Answer:

Verified
Correct Answer:
Verified
Related Questions
Q12: An oil company is trying to decide
Q13: Two dice are rolled. a. What
Q14: The line graph below shows the average
Q15: A tire company tested a particular model
Q16: The number of big-screen televisions sold each
Q18: On a certain exam, Charles corrected 12
Q19: The heights of 1100 boys at West
Q20: A drawer has 10 red socks and
Q21: The following table shows the highest education
Q22: How many ways can 6 flags be