Multiple Choice
The table below shows the age of the winners of the Clark County Innovation Award, given annually to a member of the community for the best invention, for the years 1960 through 1989.  Construct a stem-and-leaf plot to display this data.
A) 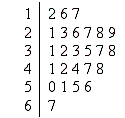
B) 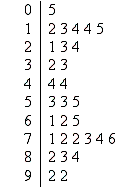
C) 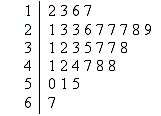
D) 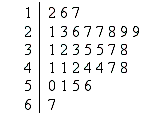
E) 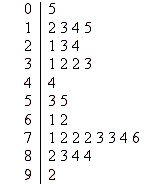
Correct Answer:

Verified
Correct Answer:
Verified
Related Questions
Q4: A class of college students collected data
Q5: How many different five-letter arrangements can be
Q6: A group of 3 children are each
Q7: The following dates all have a similar
Q8: A game of chance at the carnival
Q10: What is the probability of rolling a
Q11: How many ways are there to arrange
Q12: An oil company is trying to decide
Q13: Two dice are rolled. a. What
Q14: The line graph below shows the average