Multiple Choice
Draw a graph from the following input-output table.
A) 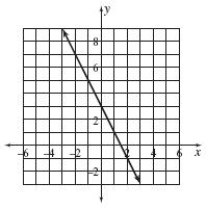
B) 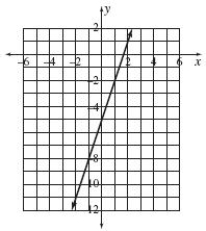
C) 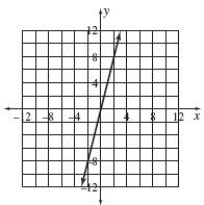
D) 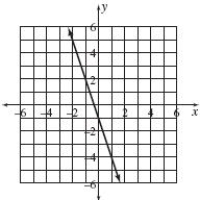
E) 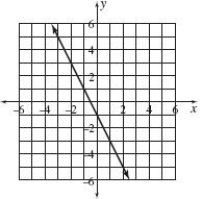
Correct Answer:

Verified
Correct Answer:
Verified
Related Questions
Q8: Name the quadrant in which the
Q9: Write the percent statement as an
Q10: Identity the constants numerical coefficients, and
Q11: Write the phrases using the correct
Q12: Kelsey is setting up the Events Center
Q14: Read "What to Expect from This Text"
Q15: Is x a negative number? Explain.<br>A) Not
Q16: Make an input-output for the following tuition
Q17: Change the decimals to percents 0.7<br>A) 7%<br>B)
Q18: Change the decimal to percent. 0.3<br>A)