Short Answer
The graph shows the relationship between the percent P of those surveyed who rated their senator's job performance as satisfactory or better and the time t she had been in office. 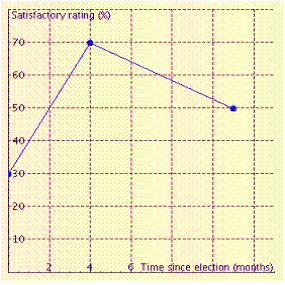 When did her job performance rating reach a maximum? __________ months after election
Correct Answer:

Verified
Correct Answer:
Verified
Related Questions
Q70: Change the equation to slope-intercept form.
Q71: The grade of a highway up a
Q72: Graph the equation using the intercept
Q73: Find the slope of the line
Q74: The cost ( c )of playing an
Q76: Graph the linear equation. <span
Q77: Solve <span class="ql-formula" data-value="7 x
Q78: Graph the equation using the intercept
Q79: Graph the equation using the intercept
Q80: Match the phrases to make true statements.