Short Answer
The graph, given below, shows the relationship between the market value v of a house and the time t since it was purchased. When did the value of the house reach its lowest point? 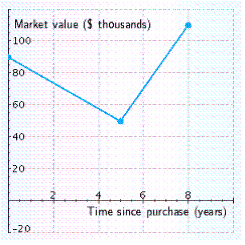 __________ years after purchase
Correct Answer:

Verified
Correct Answer:
Verified
Related Questions
Q64: Graph the linear equation. <span
Q65: The graph shown gives the first-class postage
Q66: Determine if the slopes of these lines
Q67: An automated production line uses distilled water
Q68: The point with coordinates x = -1
Q70: Change the equation to slope-intercept form.
Q71: The grade of a highway up a
Q72: Graph the equation using the intercept
Q73: Find the slope of the line
Q74: The cost ( c )of playing an