Multiple Choice
The number of cases of flu seen by doctors at a county health clinic each week during a 10-week period is described by the quadratic function f ( x ) = -4 x 2 + 40 x (graphed in the illustration) . 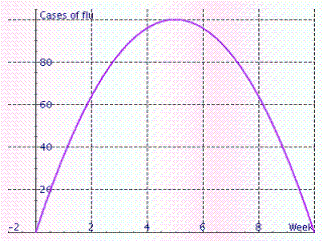 What point gives us information of the most cases of flu?
A) (5, 100)
B) (8, 100)
C) (10, 0)
D) (5, 0)
Correct Answer:

Verified
Correct Answer:
Verified
Q19: Use the quadratic formula to find
Q20: Solve the following quadratic equation using
Q21: Complete the square and factor the
Q22: Write the expression in <span
Q23: Use the method of completing the
Q25: Simplify the expression. Enter the answer
Q26: Graph the parabola <span class="ql-formula"
Q27: Write <span class="ql-formula" data-value="\sqrt {
Q28: Solve the equation. <span class="ql-formula"
Q29: Use the square root method to