Multiple Choice
The following figure shows the annual sales (in millions of dollars) of sporting goods in the United States from 1994 to 2000, where represents 1994. Use the figure to approximate the sales of sporting goods (in millions of dollars) in . 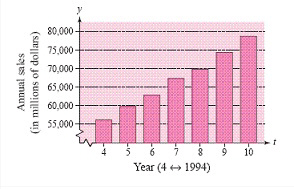
A) $
B) $
C) $
D) $
E) $
Correct Answer:

Verified
Correct Answer:
Verified
Q10: Find the sum 23+27 .<br>A)51<br>B)50<br>C)52<br>D)53<br>E)49
Q11: Evaluate the expression <span class="ql-formula"
Q12: Rewrite <span class="ql-formula" data-value="6 (
Q13: Use the Distributive Property to simplify
Q14: Evaluate <span class="ql-formula" data-value="\left| x
Q16: Evaluate <span class="ql-formula" data-value="- |
Q17: A cash register contains <span
Q18: The annual sales (in millions of
Q19: Plot 3 and its opposite on the
Q20: Write a verbal description of