Short Answer
The graph below represents a function. Use the horizontal line test to decide whether the function is one-to-one. Answer yes or no . 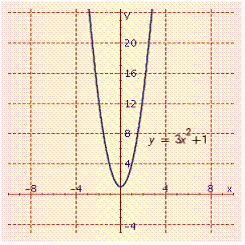
Correct Answer:

Verified
Correct Answer:
Verified
Related Questions
Q12: The area of a rectangular region is
Q15: Solve the inequality. <img src="https://d2lvgg3v3hfg70.cloudfront.net/TBX8967/.jpg" alt="Solve the
Q16: Use the method of completing the square
Q17: Use the discriminant to determine what type
Q18: Find the inverse of the given function
Q19: Graph the function. f ( x )
Q22: If <img src="https://d2lvgg3v3hfg70.cloudfront.net/TBX8967/.jpg" alt="If ,
Q23: Graph the function. <img src="https://d2lvgg3v3hfg70.cloudfront.net/TBX8967/.jpg" alt="Graph the
Q24: Solve the equation by completing the square.
Q25: For the following function, first sketch the