Multiple Choice
Which of these graphs could represent the graph of y = ln 3 x ?
A) 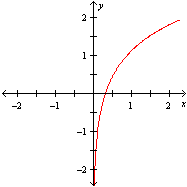
B) 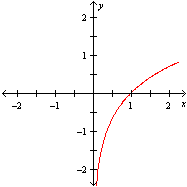
C) 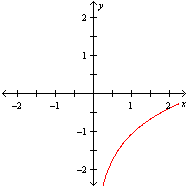
D) 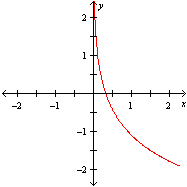
Correct Answer:

Verified
Correct Answer:
Verified
Q18: Use the formula <img src="https://d2lvgg3v3hfg70.cloudfront.net/TBX8967/.jpg" alt="Use the
Q19: Graph the exponential function. <img src="https://d2lvgg3v3hfg70.cloudfront.net/TBX8967/.jpg" alt="Graph
Q20: The population of the earth is approximately
Q21: Write the logarithmic statement in exponential form.
Q22: Assume that <img src="https://d2lvgg3v3hfg70.cloudfront.net/TBX8967/.jpg" alt="Assume that
Q24: An investment of $7,000 earns 6% interest,
Q25: Graph the exponential function. f ( x
Q26: Graph the function. <img src="https://d2lvgg3v3hfg70.cloudfront.net/TBX8967/.jpg" alt="Graph the
Q27: Graph the exponential function <img src="https://d2lvgg3v3hfg70.cloudfront.net/TBX8967/.jpg" alt="Graph
Q28: Graph <img src="https://d2lvgg3v3hfg70.cloudfront.net/TBX8967/.jpg" alt="Graph by