Short Answer
The following line graph shows the expenses for two salespeople of the Leadwell Pencil Company. 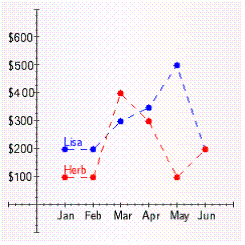 During which month did Herb incur the most expenses?
Correct Answer:

Verified
Correct Answer:
Verified
Related Questions
Q31: 10,000 respondents were asked the following question.
Q32: The wages of employees of a
Q33: The gross profits for January at Tower
Q34: The graph below shows percentages of children
Q35: 10,000 respondents were asked the following question.
Q37: The heights of 20 students are as
Q38: FIGURE 1. <img src="https://d2lvgg3v3hfg70.cloudfront.net/TBX9050/.jpg" alt="FIGURE 1.
Q39: The wages of employees of a
Q40: The gross profits for January at Tower
Q41: The heights of 20 students are as