Multiple Choice
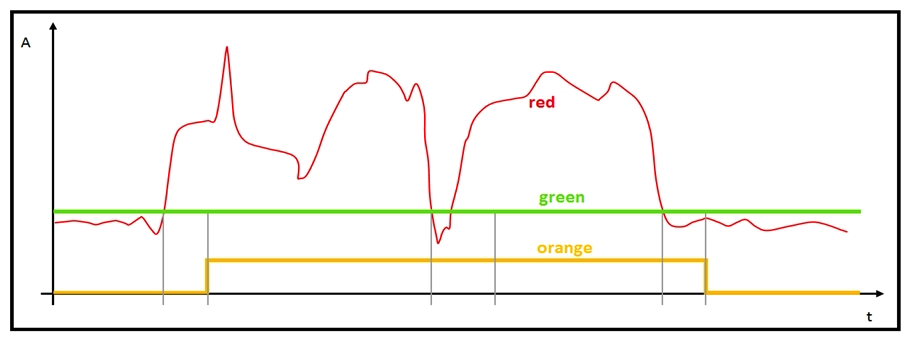 Refer to the exhibit. The red line represents the energy consumption of an industrial machine. Which two statements about the graphs are true? (Choose two.)
A) The orange graph is expected to drop to zero for a brief period around the midpoint on the x axis. The orange graph is expected to drop to zero for a brief period around the midpoint on the x axis.
B) The red graph contains the raw data points.
C) The green graph is the mean value of the data points.
D) The green graph does not give us any valuable information.
E) The orange graph has three values on the y -axis. The orange graph has three values on the y -axis.
Correct Answer:

Verified
Correct Answer:
Verified
Q6: A company is collecting data from several
Q7: Which computer security concept is violated when
Q8: Which two statements define the mechanism for
Q9: As part of an IoT project, an
Q10: Which two security approaches help build a
Q12: Which action should be taken when a
Q13: When constructing a Python script for data
Q14: <img src="https://d2lvgg3v3hfg70.cloudfront.net/C1178/.jpg" alt=" Refer to the
Q15: Which method defines the integration of Cisco
Q16: <img src="https://d2lvgg3v3hfg70.cloudfront.net/C1178/.jpg" alt=" Refer to the