True/False
Figure 2-10
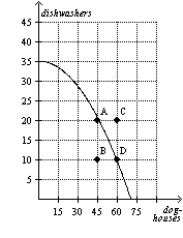
-Refer to Figure 2-10. Points A, B, and D represent feasible outcomes for this economy.
Correct Answer:

Verified
Correct Answer:
Verified
Q3: When two variables move in the same
Q4: Figure 2-12<br><br> <img src="https://d2lvgg3v3hfg70.cloudfront.net/TB7555/.jpg" alt="Figure 2-12
Q5: Since 1946, the president of the United
Q6: In the circular-flow diagram, firms own the
Q7: Kiara wants to create a graph containing
Q9: The slope of a line that
Q10: Figure 2-10<br><br> <img src="https://d2lvgg3v3hfg70.cloudfront.net/TB7555/.jpg" alt="Figure 2-10
Q11: Points outside the production possibilities frontier represent
Q12: Figure 2-13<br><br> <img src="https://d2lvgg3v3hfg70.cloudfront.net/TB7555/.jpg" alt="Figure 2-13
Q13: In the circular-flow diagram, firms consume all