Short Answer
Figure 2-13
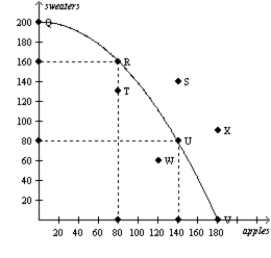 Consider the production possibilities curve for a country that can produce sweaters, apples (in bushels), or a combination of the two.
-Refer to Figure 2-13. Which point(s) on the graph show unemployment of resources?
Correct Answer:

Verified
Correct Answer:
Verified
Q197: Duties of the Council of Economic Advisers
Q198: Figure 2-3<br> <img src="https://d2lvgg3v3hfg70.cloudfront.net/TB7555/.jpg" alt="Figure 2-3
Q199: Economists try to address their subject with
Q200: What you must give up to get
Q201: Figure 2-15<br><br> <img src="https://d2lvgg3v3hfg70.cloudfront.net/TB7555/.jpg" alt="Figure 2-15
Q203: Figure 2-8<br> <img src="https://d2lvgg3v3hfg70.cloudfront.net/TB7555/.jpg" alt="Figure 2-8
Q204: Which of the following is an example
Q205: Figure 2-4<br>Graph (a)<br>Graph (b)<br> <img src="https://d2lvgg3v3hfg70.cloudfront.net/TB7555/.jpg" alt="Figure
Q206: In the circular-flow diagram,<br>A)factors of production flow
Q207: A production possibilities frontier has a bowed