Multiple Choice
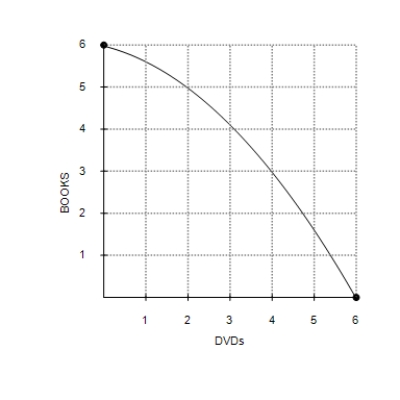
Figure 2-4
Graph (a)
Graph (b)
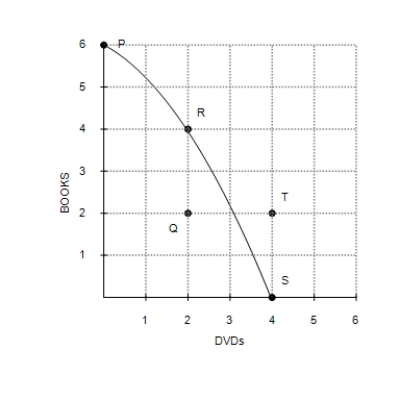
-Refer to Figure 2-4, Graph (a) . Production at point Q is
A) possible and efficient.
B) possible but inefficient.
C) impossible but efficient.
D) impossible and inefficient.
Correct Answer:

Verified
Correct Answer:
Verified
Q9: The slope of a line that
Q10: Figure 2-10<br><br> <img src="https://d2lvgg3v3hfg70.cloudfront.net/TB7555/.jpg" alt="Figure 2-10
Q11: Points outside the production possibilities frontier represent
Q12: Figure 2-13<br><br> <img src="https://d2lvgg3v3hfg70.cloudfront.net/TB7555/.jpg" alt="Figure 2-13
Q13: In the circular-flow diagram, firms consume all
Q15: Figure 2-14<br><br> <img src="https://d2lvgg3v3hfg70.cloudfront.net/TB7555/.jpg" alt="Figure 2-14
Q16: When a variable that is named on
Q17: Is the following a positive or normative
Q18: Which of the following statements about models
Q19: Figure 2-6<br> <img src="https://d2lvgg3v3hfg70.cloudfront.net/TB7555/.jpg" alt="Figure 2-6