Multiple Choice
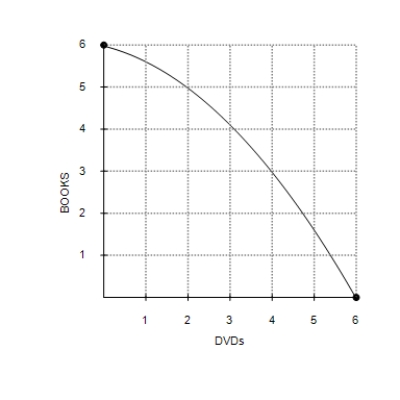
Figure 2-4
Graph (a)
Graph (b)
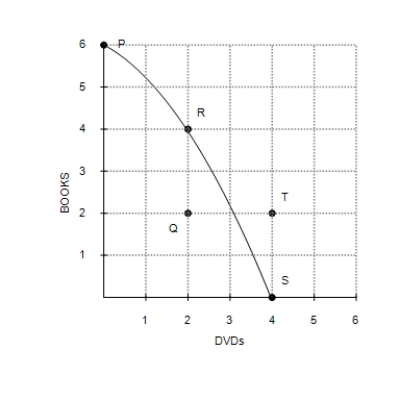
-Refer to Figure 2-4, Graph (a) . Production is
A) possible at points P, Q, R, and S, but efficient only at points P, R, and S.
B) possible at points P, Q, R, and S, but efficient only at point Q.
C) possible at points P, R, S, and T, but efficient only at points P, R, and S.
D) possible at points P, R, S, and T, but efficient only at point T.
Correct Answer:

Verified
Correct Answer:
Verified
Q148: In the circular-flow diagram, payments for labor,
Q149: A production possibilities frontier will be bowed
Q150: Historical episodes allow economists to illustrate and
Q151: Table 2-4<br> <span class="ql-formula" data-value="\begin{array}
Q152: Sometimes economists disagree because their scientific judgments
Q154: How are economists not like mathematicians, physicists,
Q155: In economics, graphs serve two purposes: they
Q156: Examples of graphs of a single variable
Q157: The art in scientific thinking-whether in chemistry,
Q158: Economists at which administrative department help design