Multiple Choice
Figure 2-7
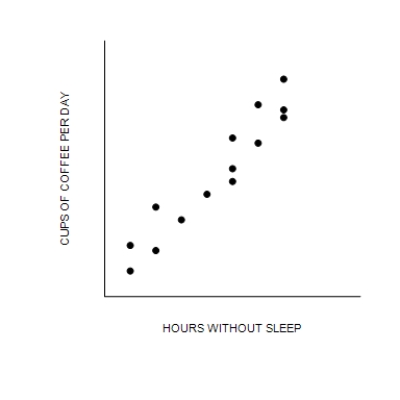
-Refer to Figure 2-7. The graph shown is known as a
A) time-series graph.
B) bar graph.
C) scatterplot.
D) pie chart.
Correct Answer:

Verified
Correct Answer:
Verified
Q224: Analysis of data on workers and those
Q225: Figure 2-13<br><br> <img src="https://d2lvgg3v3hfg70.cloudfront.net/TB7555/.jpg" alt="Figure 2-13
Q226: The x-coordinate of an ordered pair specifies
Q227: Justin and Madison are economists. Justin thinks
Q228: Figure 2-6<br> <img src="https://d2lvgg3v3hfg70.cloudfront.net/TB7555/.jpg" alt=" Figure
Q230: Economists at the U.S. Department of Justice
Q231: When two variables move in opposite directions,
Q232: When economists disagree about whether a policy
Q233: Figure 2-2<br> <img src="https://d2lvgg3v3hfg70.cloudfront.net/TB7555/.jpg" alt="Figure 2-2
Q234: Table 2-2<br><br> <span class="ql-formula" data-value="