Multiple Choice
Figure 2-8
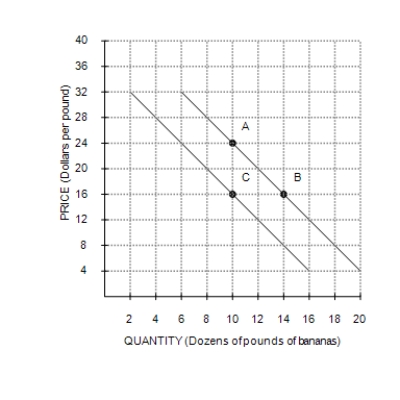
-Refer to Figure 2-8. The slope of the curve between points A and B is
A) -2.
B) 2.
C) .
D) .
Correct Answer:

Verified
Correct Answer:
Verified
Q175: From which of the following agencies does
Q176: When a production possibilities frontier is bowed
Q177: An economy's production of two goods is
Q178: Figure 2-4<br>Graph (a)<br>Graph (b)<br> <img src="https://d2lvgg3v3hfg70.cloudfront.net/TB7555/.jpg" alt="Figure
Q179: Figure 2-10<br><br> <img src="https://d2lvgg3v3hfg70.cloudfront.net/TB7555/.jpg" alt="Figure 2-10
Q181: Points inside the production possibilities frontier represent
Q182: The effects of borrowing by the federal
Q183: The Council of Economic Advisers consists of
Q184: Like biologists and physicists, economists use the
Q185: Figure 2-3<br> <img src="https://d2lvgg3v3hfg70.cloudfront.net/TB7555/.jpg" alt="Figure 2-3