Multiple Choice
Refer to the figure.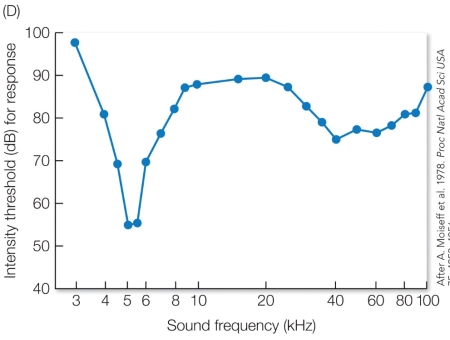 Based on the information in the graph, what would you predict is the sound frequency (kHz) of male cricket calls?
A) 3-kHz, because the intensity threshold is at its highest point and it is a low-frequency.
B) 5-kHz, because the intensity threshold is at its lowest point and it is a low-frequency.
C) 40-kHz, because there is a dip in the intensity threshold and it is a high-frequency.
D) 100-kHz, because the intensity threshold is high, and it is the highest frequency recorded.
Correct Answer:

Verified
Correct Answer:
Verified
Q12: Refer to the figure.<br> <img src="https://d2lvgg3v3hfg70.cloudfront.net/TBO1022/.jpg" alt="Refer
Q13: Why would some bird chicks, such as
Q14: When int-1, the interneurons located on each
Q15: The complex, specialized hearing system that noctuid
Q16: Refer to the figure.<br> <img src="https://d2lvgg3v3hfg70.cloudfront.net/TBO1022/.jpg" alt="Refer
Q17: When an incubating graylag goose sees a
Q19: Refer to the figure.<br> <img src="https://d2lvgg3v3hfg70.cloudfront.net/TBO1022/.jpg" alt="Refer
Q20: Despite the lack of brain-controlled neural circuitry,
Q21: Stimulus filtering is an adaptation in the
Q22: A male moth detects a distant female