Multiple Choice
Refer to the figure shown.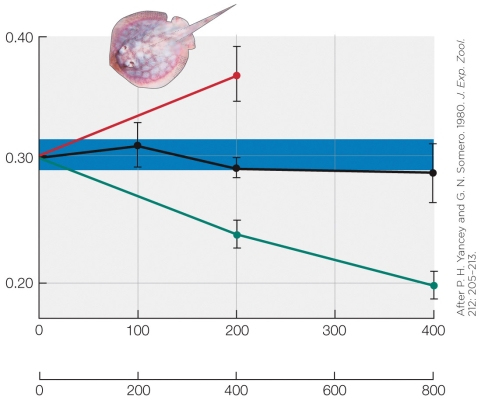 The shaded area on the graph represents the
A) rate of enzyme catalysis.
B) normal enzyme substrate affinity.
C) normal range of osmolarity.
D) optimal metabolic rate.
Correct Answer:

Verified
Correct Answer:
Verified
Related Questions
Q1: Choose a salinity that isn't commonly measured
Q3: If the osmotic U/P ratio is less
Q4: If you go to the movie theater
Q5: Refer to the figure shown.<br><img src="https://d2lvgg3v3hfg70.cloudfront.net/TBO1030/.jpg" alt="Refer
Q6: Typically, if the blood osmolarity were 500
Q7: Explain what the osmotic U/P ratio is
Q8: Which animal has the lowest K value?<br>A)
Q9: Which collection of solutes, when dissolved in
Q10: Seawater in the open ocean has a
Q11: Refer to the formula shown.<br>The rate of