Multiple Choice
Refer to the figure shown.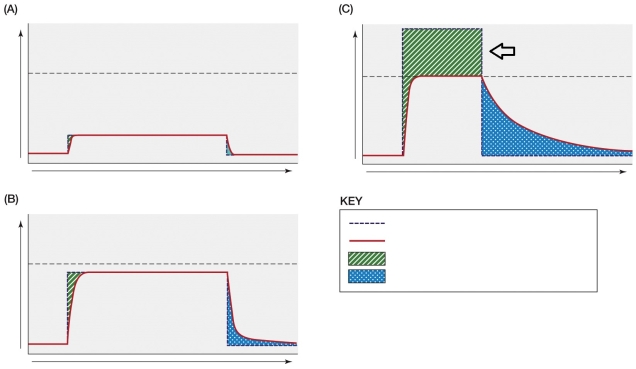 Where is the maximum oxygen consumption represented on the graphs?
A) The horizontal dashed line
B) The shaded area at the beginning of the solid line curve
C) The shaded area at the end of the solid line curve
D) The solid curve line
Correct Answer:

Verified
Correct Answer:
Verified
Q18: Explain, on the molecular level, why muscles
Q19: Aerobic substrate-level phosphorylation produces a total of
Q20: Which chemical reaction of the Krebs cycle
Q21: When invertebrate anaerobes excrete their anaerobic byproducts,
Q22: The rate-limiting factor that determines whether a
Q24: Which chemical reaction of the Krebs cycle
Q25: _ exercise is the type of exercise
Q26: Which statement about a rabbit and a
Q27: In the term "fast glycolytic" used to
Q28: Fast glycolytic muscle fibers are used during<br>A)