Multiple Choice
Refer to the figure.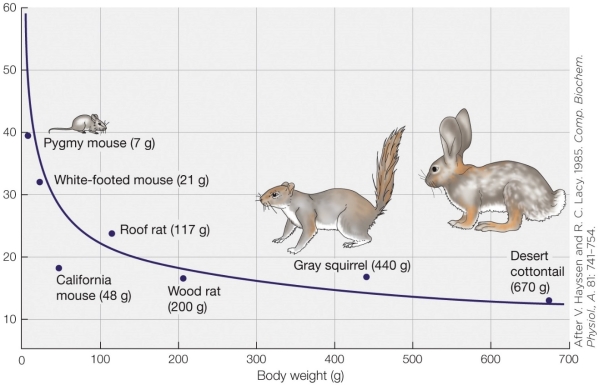 Where on the graph would you plot a wood frog?
A) About half way down directly below the pygmy mouse data point
B) Close to the x axis in the 0- to 100-gram weight range
C) Very close to the wood rat data point
D) About twice as high as the white-footed mouse data point
Correct Answer:

Verified
Correct Answer:
Verified
Q25: For which macromolecule is the conversion factor
Q26: Sprinting is an activity that relies heavily
Q27: Suppose you use indirect calorimetry to estimate
Q28: You measure the metabolic rate of a
Q29: Rubner's surface "law" cannot be applied to
Q31: Suppose that W (weight) for groups of
Q32: Suppose the value of b for the
Q33: The increase in the metabolic rate of
Q34: Attempts to explain the mechanistic basis for
Q35: Specific conditions must apply when either basal