Multiple Choice
Refer to the figure.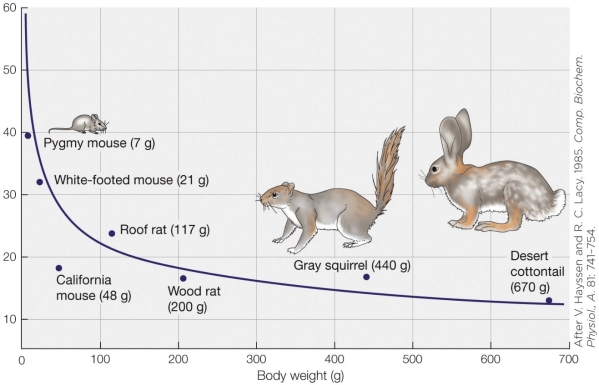 Based on the graph, change the scale of both axes and change the y axis units to be non-mass-specific. What is the best description of the line that fits the replotted data?
A) A straight line that begins low on the y axis and increases moving along the x axis
B) A straight line that begins high on the y axis and decreases moving along the x axis
C) Very similar shape to the plot above with different units on the y axis
D) An exponential curve that begins low on the y axis and increases moving along the x axis
Correct Answer:

Verified
Correct Answer:
Verified
Q17: A 30-g vole eats 175 g of
Q18: Suppose you are a livestock manager tasked
Q19: Suppose the relationship between resting heart rate
Q20: Suppose you eat five cookies, each of
Q21: Assume that the standard allometric equation (M
Q23: As part of an exercise program, a
Q24: If an animal's metabolic rate is measured
Q25: For which macromolecule is the conversion factor
Q26: Sprinting is an activity that relies heavily
Q27: Suppose you use indirect calorimetry to estimate