Multiple Choice
Refer to the graphs shown.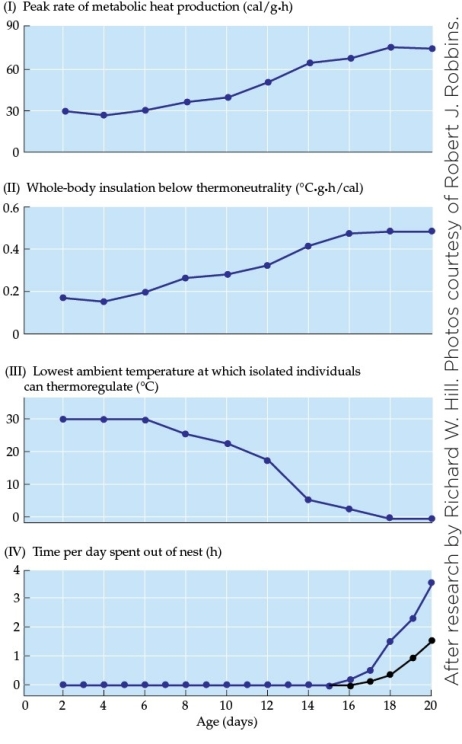 What contributes most significantly to the data shown in figure II?
A) An increase in brown fat
B) An increase in the adipose layer under the skin
C) An increase in the thickness of the epidermis
D) The development of fur
Correct Answer:

Verified
Correct Answer:
Verified
Q7: Refer to the figure shown.<br><img src="https://d2lvgg3v3hfg70.cloudfront.net/TBO1030/.jpg" alt="Refer
Q8: Blue mussels _ in response to the
Q9: Seasonal polyphenism in the western white butterfly
Q10: In the killifish, the _ are responsible
Q11: Explain why 5-year-old children may be particularly
Q13: Refer to the figure shown.<br><img src="https://d2lvgg3v3hfg70.cloudfront.net/TBO1030/.jpg" alt="Refer
Q14: Explain two major mechanisms of epigenetic marking.
Q15: The physiological regulation of body temperature is
Q16: What is the likely adaptive advantage in
Q17: In an 8-day-old killifish, the major site