Multiple Choice
Refer to the figure shown.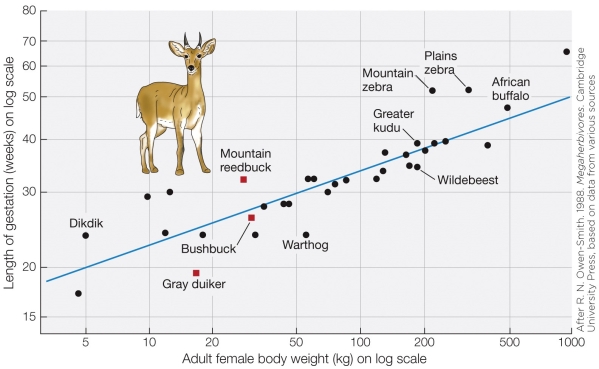 What statistical method was used to draw the trend line in the figure?
A) Phylogenetically independent contrasts
B) Ordinary least squares regression
C) Weight-specific mean
D) Logarithmic scaling
Correct Answer:

Verified
Correct Answer:
Verified
Q8: Research in the field of _ physiology
Q9: Refer to the figure shown.<br><img src="https://d2lvgg3v3hfg70.cloudfront.net/TBO1030/.jpg" alt="Refer
Q10: The raw material(s) for evolution is(are)<br>A) trait
Q11: _ is an example of "abandoning constancy"
Q12: Which of the five timeframes in which
Q14: Choose the best example of an animal
Q15: Why is studying salmon migration important to
Q16: The shift in gene frequencies in smaller
Q17: Rainbow trout captured and brought into a
Q18: Which statement regarding animals is true?<br>A) There