Multiple Choice
In which of the following causal diagrams is the predicted relationship between X and Y negative?
A) 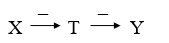
B) 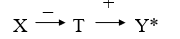
C) 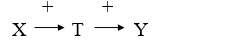
D) 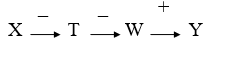
Correct Answer:

Verified
Correct Answer:
Verified
Related Questions
Q34: Which of the following is not typically
Q35: Using the 2016 GSS, we regressed the
Q36: Leaving out important variables from a model
Q37: Which statement below best summarizes the path
Q38: A zero-order relationship means that there is
Q40: Each coefficient in a path analysis, called
Q41: Multivariate regression is more likely than bivariate
Q42: Path analysis provides quantitative estimates of both
Q43: A multivariate cross-tabulation with one control variable
Q44: A dummy variable in a multiple regression