Not Answered
The 1994 GSS asked the following question: Do you sometimes drink more than you think you should? The table below breaks down responses to this question by sex.
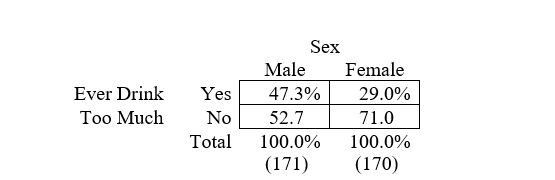 a. What is the percentage difference for determining the association between these variables?
b. Who is more likely to say that they sometimes drink more than they think they should?
c. Chi-square for this table is 12.50, which is significant at p < .001. What does this indicate about the relationship between the variables?
d. The value of phi for this table is .19. What does this statistic tell us about the relationship?
Correct Answer:

Verified
Correct Answer:
Verified
Q24: In the absence of theoretical criteria, the
Q25: The chi-square test for independence in a
Q26: To interpret the relationship between variables in
Q27: Suppose a small campus survey found that
Q28: Linear regression analysis should be used only
Q30: Listwise deletion is the best method of
Q31: Describe the differences in the bivariate analysis
Q32: Using computer-assisted interviewing eliminates the need for
Q33: Univariate distributions of interval-/ratio-scale variables include all
Q34: What is the usual order of steps